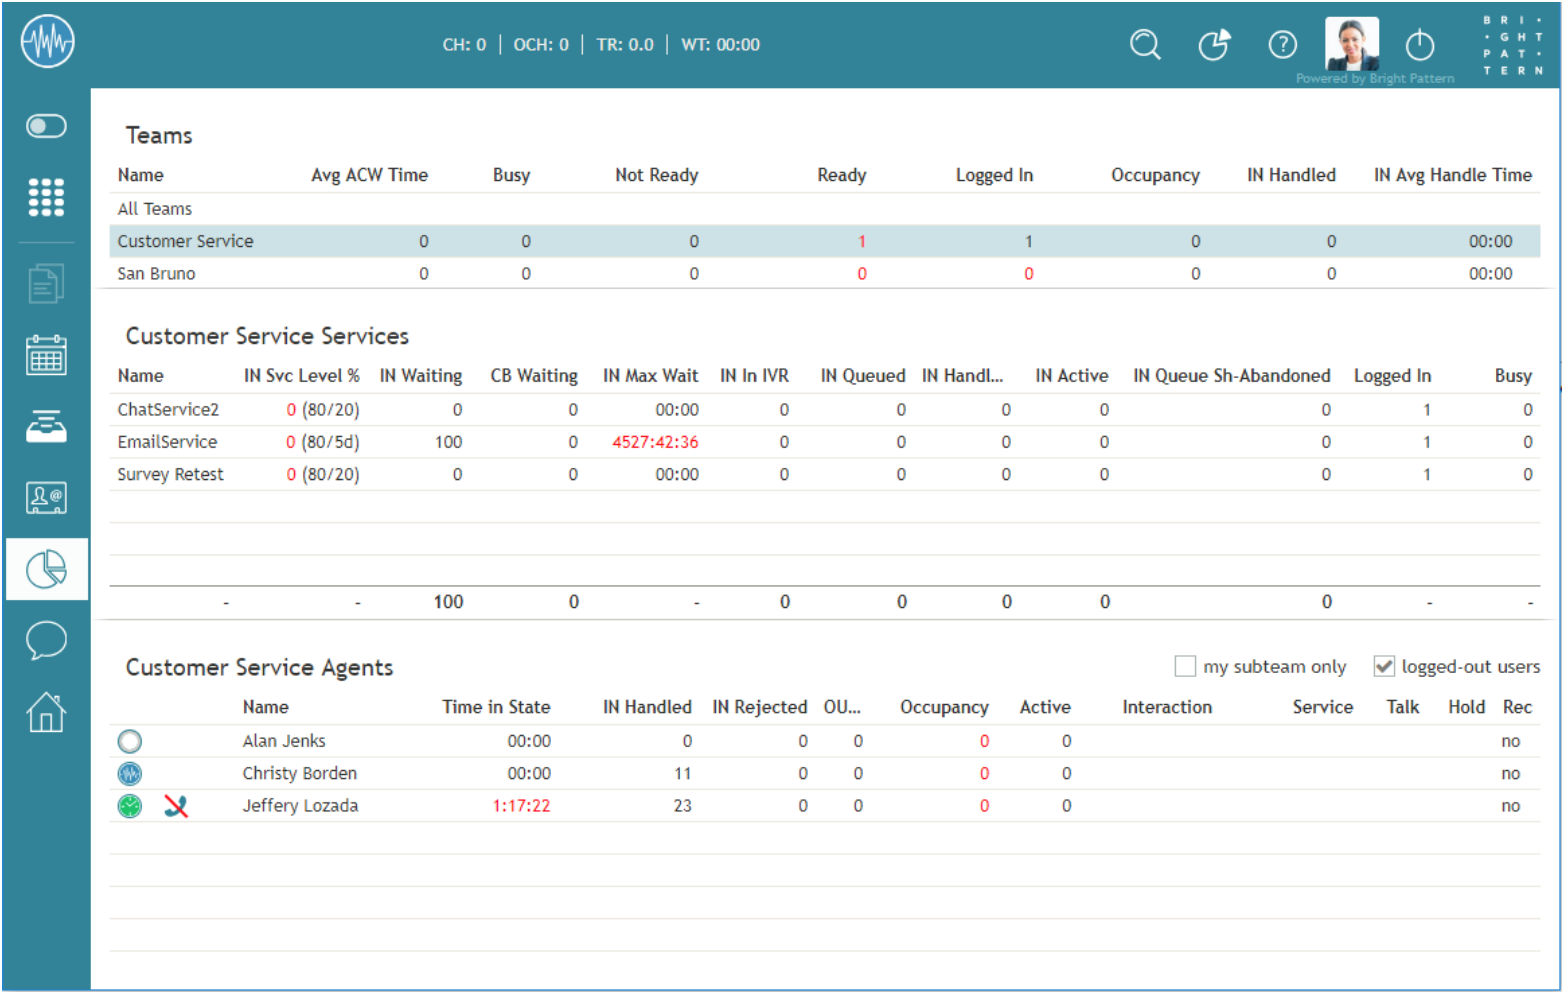
In our last blog, we discussed some real-time key performance indicators (KPIs), also known as metrics, that supervisors use on a daily basis to monitor the status and productivity of their agents, teams, and services. This time, we’ll check out some handy dashboard metrics, which span all the KPI categories we previously covered.
A dashboard is an area of the Agent Desktop that displays abbreviated, at-a-glance metrics that help both agents and supervisors easily monitor important areas of work, such as the amount of time agents spend doing after-call work, how many inbound calls have been handled, and so on. Key KPIs include AHT (average handling time), dropped call rates, and CSAT (customer satisfaction). Like a scoreboard during a game, a dashboard provides real-time updates of key selected metrics that are helpful to both agents and supervisors. Most contact centers use metrics to boost agent and team performance and increase the quality of the interactions handled.
The names of these metrics are typically abbreviated so that more can fit in a small space. Supervisors will get to know these names as they go about their day-to-day operations. It’s possible to display any combination of these metrics. The ones that get displayed on your Agent Desktop dashboard really depend on the needs of your contact center, agents, teams, and services.
Typically, channels are monitored and sampled to get data for the key metrics and dashboard reporting. However, especially in the new mobile digital age, it is getting more difficult to effectively monitor channels of communication within a contact center.
Bright Pattern offers dashboard metrics and key KPIs, allowing contact centers to get a snapshot of the entire contact center operation, like handling times, outbound calls dialed, and inbound calls received. On top of that, however, Bright Pattern is also built on an omnichannel platform, allowing contact centers to monitor 100% of all interactions on all channels of communication.

Real-time dashboards provide a broad view of everything that affects customer service and satisfaction:
- Status: Where are the customers now—in IVR, on hold, waiting, being helped?
- Abandonment: How many interactions were abandoned or dropped?
- Dropped calls/chats: How many interactions were dropped, and why?
- What’s in the queue: How many customers are waiting to be helped?
- Service level: How many calls and interactions have been accepted and handled today?
Insight-Driven Contact Center
KPIs provide the insights you need for improving agent engagement and elevating the customer experience. The customer experience hinges on empowering agents with the right training, tools, and service model. Bright Pattern’s omnichannel contact center software helps empower agents with unique tools that facilitate better conversations, boost agent performance, and deliver higher returns in customer satisfaction and agent engagement. Bright Pattern allows your contact center to monitor 100% of all interactions on all channels with Omni QM technology, making your contact center an insight-driven operation. Having a unified and powerful Agent Desktop that displays important KPIs helps to keep supervisors focused on teams and agents focused on customers.
Learn more about how contact center KPIs, and call center insights can empower agents and boost contact center efficiency and productivity by checking out our powerful Omni QM features.


