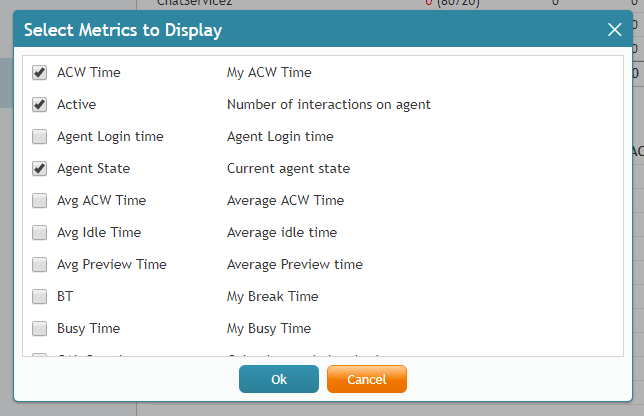
In your day-to-day contact center operations, everything under the sun can be measured, reported on, and popped to your screen. When you’re bombarded by data, only the most-used KPIs deserve a spot on your agent desktop. How do you know which KPIs are the most valuable to your team, contact center, and business?
Before we begin, let’s define what a KPI is. A Key Performance Indicator (KPI), also called a metric, is a value that you can measure, one that shows just how effective your business is at achieving its goals. If your top business goal is to boost customer satisfaction, for example, you’ll probably want to keep an eye on KPIs such as call abandonment rates, survey responses, average handle time, and so forth. Contact centers use metrics to collect specific data from every interaction, service, queue, agent, survey, and more.
In any contact center, the real-time metrics that supervisors use daily generally fall into common categories, such as these:
- Agent metrics
- Campaign-specific metrics
- List metrics
- Service metrics
- Skill metrics
- Team metrics

Nestled in each category, there can be dozens, if not hundreds, of metrics.
Your Agents, At-a-Glance
Do you know what your agents are doing, right now? Supervisors need dashboards and wallboards with real-time KPIs that signal which agents and teams need to be monitored. And when there are 50+ KPIs to choose from, how do you know which ones are the most important? The more metrics you add to a dashboard, the less useful a dashboard becomes. In this blog, we will focus on some of the most-useful real-time agent metrics for contact center supervisors to watch.

Agent State
An agent’s state indicates whether or not the agent can handle an interaction. It may seem basic, but this information is very useful to the supervisor monitoring a team of agents working both in-house and remotely. Agent State provides an at-a-glance look at whether agents are ready, not ready, busy, idle, or doing after-call work. For agents in the Not Ready state, this metric also provides the reason (e.g., lunch, break, meeting, etc.).
Agent State shows what every logged in agent on your team is doing right now. If all your agents are busy, you know why the queue is filling up with calls, or why callers are still on hold. Likewise, if all your agents are ready yet the queue is backed up and customers are not being helped, you have reason to suspect your services are not running.

Time in State
Time in State is how long (in minutes and seconds) an agent has been ready, not ready, and so forth. Generally supervisors will know what duration is acceptable for service calls, chats, breaks, and after-call work, and the Time in State metric will give them a cursory view of who’s working as expected, who’s slacking, and who needs help. For example, the supervisor may want to check in on an agent who’s been in the Not Ready state for 24 minutes, with no reason given.
ACW Time
After-call work (ACW) consists of all the tasks that agents must do before they can complete the interaction, tasks such as setting a disposition, creating contacts, writing notes, setting follow-ups, and more. These tasks are important but tedious. Agents in the ACW state cannot handle a new interaction until this work is done.
ACW Time can show you which agents and teams are not accepting new interactions because they’re still working on the old. High ACW time can indicate it’s time to relieve your agents of this type of work and automate the tasks instead.
Sentiment
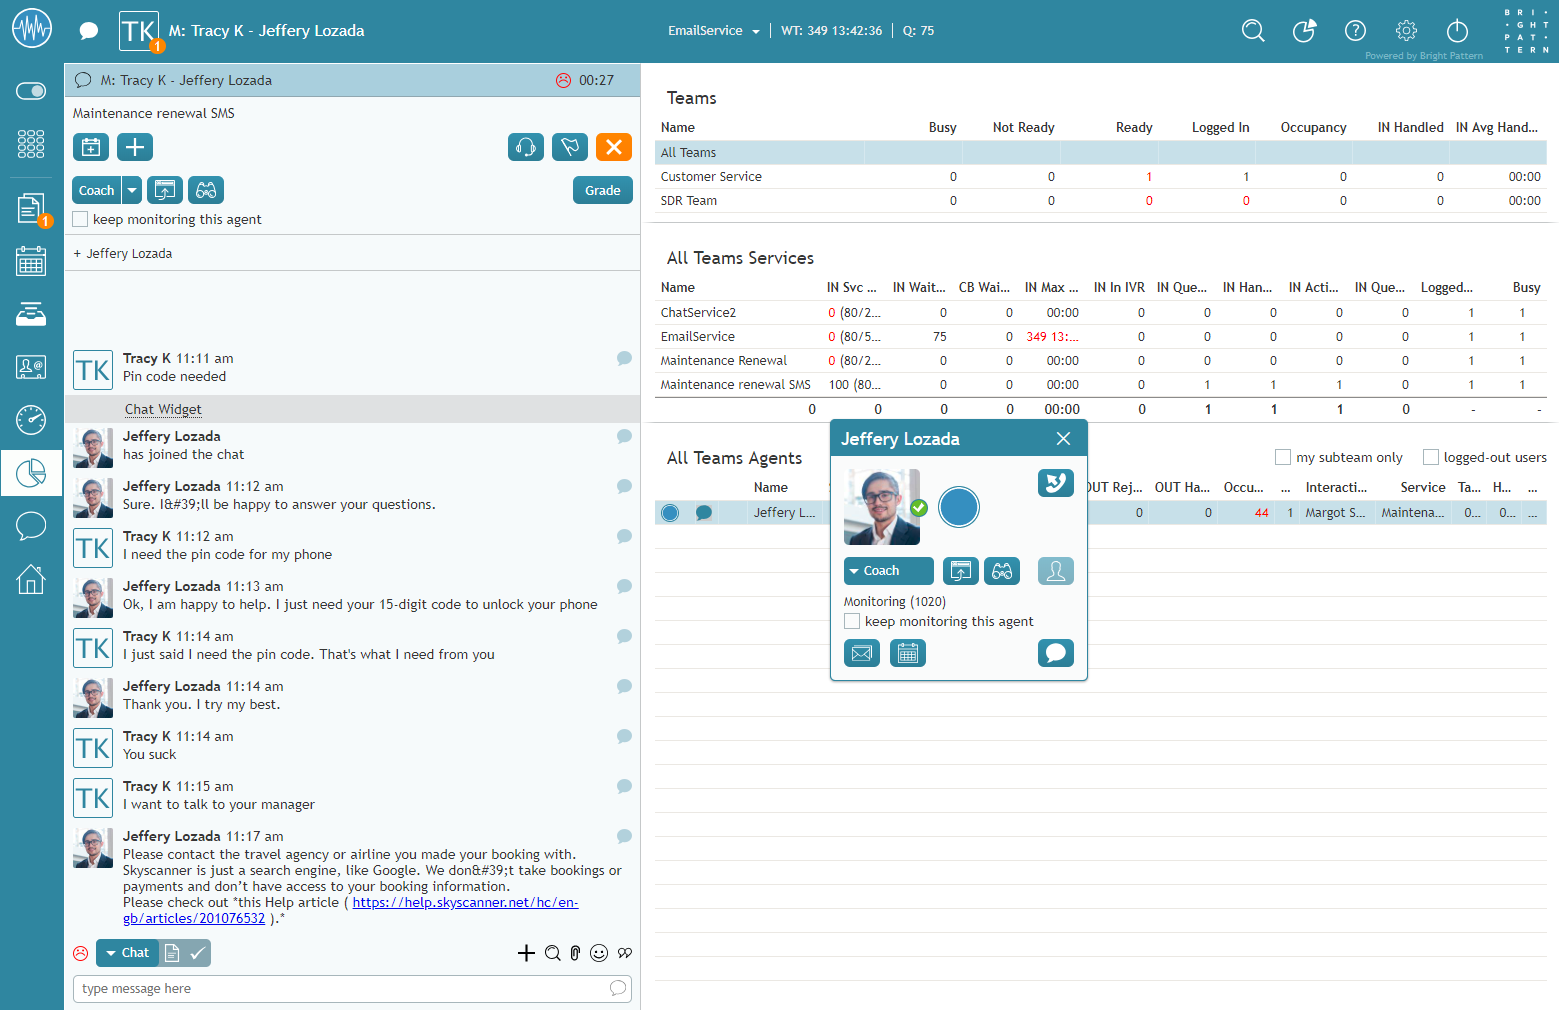
Displayed as faces that are happy, neutral, or angry, sentiment provides a quick glimpse at the general mood and satisfaction level of your customers, in real time. It’s not the sentiment of your agents. Happy faces mean happy customers, and angry ones spell low customer satisfaction and poor reviews.
When agents chat with a customer, for example, the system is utilizing Natural Language Understanding and other cognitive technologies to assess the customer’s satisfaction level. Positive keywords, statements, and expressions become happy faces in the supervisor’s monitoring screen and in the agent’s active interaction. Sentiment is also saved in interaction records and chat transcripts.
The sentiment of an unhelpful chat session would immediately appear on the agent’s screen within the chat as well as on the supervisor’s screen. A slew of angry faces in the supervisor’s list view of active agent interactions means the supervisor should monitor those agents and step in to help.
Customer Satisfaction
Customer Satisfaction (CSAT) is the average result of surveys where the customer satisfaction question has been answered. The best way to know how your customers feel about your service, agents, products, or anything else, is to ask them.
Net Promoter Score
Net Promoter Score (NPS) is the percentage of points for all surveys where a response was given for the contact satisfaction question. The percentage is calculated out of the number of interactions, where surveys exist, by subtracting the percentage of promoters (values 9 and 10) by the percentage of detractors (values 0 to 6).
You want to have a high NPS at all times. Customers are more likely to respond positively to a contact satisfaction question if they had a good experience with a knowledgeable, helpful agent. For contact centers, NPS is a key way to measure success.
A Contact Center Driven by Insights
Specific metrics provide key information about your contact center performance. These KPIs provide the insights you need to ensure optimal contact center performance and great customer service with every interaction.
The customer experience hinges on empowering agents with the right training, tools, and service model. Bright Pattern’s omnichannel contact center software helps empower agents with unique tools that facilitate better conversations, boost agent performance, and deliver higher returns in customer satisfaction and agent engagement. Bright Pattern features Omni QM, a omnichannel quality management platform, as well as unified reporting to allow your contact center to monitor interactions on all digital channels, including mobile ones. Bright Pattern allows you to gain insight into your contact center to help you deliver better customer service.
Learn more about how contact center KPIs, and call center insights can empower agents and boost contact center efficiency and productivity by checking out our quality management capabilities.


